
83Uploads
9k+Views
5k+Downloads
Business and finance

Franchises / Franchising
This PowerPoint is a 20 slide resource that containd the following:
A colourful title slide with lesson objectives and animations
An editable ‘guess the starter’ activity
Franchising logo activity
McDonalds information video
Notes
Additional activities
This presentation took me 45 minutes to go through with my students

Market Share
This presentation includes:
A colourful title slide with learning objectives and clickable timer to give students a minute and a half to get down the title
Detailed notes providing explanations of markets, market growth, calculation of market share, how market share increases as well as the benefits of high market share
3 mini activities; 1 - Calculating market share, 2 - Which markets are growing and shrinking in size 3 - Which business is the market leader in 4 different industries
This lesson took me 30 minutes to go through with my students
Product Lifecycle
Included in this PowerPoint presentation;
A colourful title slide outlining the key learning objectives
A fun Catchphrase starter activity that my students adore!
An introductory slide explaining what the lesson is about
An introductory game where students have to recognise brands of drinks currently / previously owned by Coke (this activity links into product lifecycle)
A hyperlinked video about the rise and fall of Subway (10 mins in length)
Detailed and colourful notes on what the product lifecycle is and what happens at each stage
A simple class activity where students have to be creative and think about how to extend the product lifecycle for 4 random products (I get students to either stand up and explain their suggestions / draw them)
Colourful gifs and animations are included throughout to ensure full engagement from students
This lesson contains 38 slides and took me a full hour to complete with all the activities included

Porter's Five Forces
This PowerPoint introduces the theory of Porter’s Five Forces
Contextualised examples included (including why Apple hasn’t entered the airline example)
Each force is explained individually
Notes provided throughout
PowerPoint is colourful and engaging

Market Structures and Competition
This lesson can be used either to teach Business students about competition, market structures and how consumers can be affected by anti-competitive practices OR to teach Economics students about the different features of market structures and why competition / a lack of competition affects different stakeholders.
Included in this lesson:
A colourful and detailed title slide outlining the key learning objectives
An income elasticity of demand starter activity suitable for both Business and Economics students (calculation / explain / diagram question). A printable slide of the questions has been provided with a detailed answer key on next slide for peer marking.
A detailed and contextualised example of how a lack of competition affects different stakeholders (Epic Games legal battle with Apple over Fortnite)
Brainstorming activity on competition
A rank in order activity on types of competitive markets
Detailed notes on competition, monopolies, oligopolies, monopolistic competition, perfect competition, Game Theory, types of anti-competitive practices such as Cartels, OFT.
This presentation contains 37 slides and took me an hour to go through with my students.

Cash Flow Forecast Full Worksheet
This worksheet tests students understanding of the importance of cash, cash flow forecasts and how to solve cash flow problems.
There are five activities included in this resource:
Activity 1 - A fill the blanks activity testing students’ understanding of key cash flow terminology
Activity 2 - A cash flow forecast with missing values that students will need to calculate
Activity 3 - A true or false activity that tests students’ ability to interpret the information from the cash flow forecast they completed for activity 2
Activity 4 - An anagram activity where students have to solve five anagrams of ways businesses can solve cash flow problems. Once solved, they need to briefly explain how each method helps with poor cash flow
Activity 5 - A picture round where students look at 9 good and services, and have to decide which four of the nine are likely to experience short-term cash-flow problems. A brief answer is required underneath explaining their reasons for each answer
All answers have been provided in depth
This can be completed in class / for homework / as a peer marked activity to save you marking!
This worksheet took students around 25 minutes to complete

Marketing Mix - Price
This resource is a 58 slide PowerPoint presentation that gives a comprehensive overview of pricing strategies. Included in this resource:
A colourful title page outlining the learning objectives
A fun catchphrase starter activity where students have to guess the name of a business / product from the pictures given [answers included]
A critical path analysis recap activity [answers included]
An introductory explanation of the importance of pricing products correctly
Detailed explanations with examples of market-based, competition-based and cost-based pricing strategies
Colourful examples provided throughout
Calculation activities [with answers] for the cost-based pricing strategies
Colourful gifs and animation are included throughout
This lesson took me just over an hour to go through with students.

Average Rate of Return
Included in this lesson:
A detailed and colourful title slide, including all learning objectives for this topic
A recap starter activity on calculating the payback period (answers included)
An explanation slide as to what the lesson is about; providing an overview of the problems of relying solely on the payback period as a method of investment appraisal and why other methods are also needed
Explanation of what ARR is
A scenario showing how ARR is calculated
An evaluation of ARR
There are 22 slides in total and it took me around 30 minutes to go through the presentation.

Business Location
A 20 slide PowerPoint presentation outlining the qualitative and quantitative factors businesses consider when choosing a business location.
The PowerPoint is colouful, informative and includes a ‘Tenable’ game show PowerPoint where students have to identify 10 common reasons why businesses fail

Critical Path Analysis
Included in this resource is a detailed, colourful, engaging and informative presentation on critical path analysis. I have broken this topic down in easy to understand sections as students often find it very challenging.
The PowerPoint contains:
A detailed and colourful title slide that includes all learning objectives
A fill the blanks recap starter activity on ratio analysis / financial statement. All answers are included.
An explanation of what project management is and its importance. Contextualised examples of projects applicable to critical path are included
**A hyperlink to a great video **of Apple’s new HQ is included. It shows the scale of the project, cost and time taken
An activity where students learn the importance of completing activities simultaneously to save time rather than a sequence
A step by step breakdown over 10 slides on what a network diagram is, what the values and characters mean, and how to work out EST, LFT, critical path.
5 network diagrams ranging in difficulty all with answers provided
Detailed notes and activities on float times
Notes on the advantages and disadvantages of critical path as well as how to evaluate the usefulness of critical path analysis as a planning tool
A separate supplementary worksheet is included in this resource with all of the activities included in the PowerPoint. These can be printed for students. All answer are in the presentation.
Animations have been used throughout to make this as engaging for students as possible
The presentation contains 52 slides and took me two and a half hours to go through with students.

Payback Period (PBP) Worksheet
A simple worksheet where students need to calculate the payback period of 4 investment options.
Answer key included
Marketing Objectives
A colourful and engaging resource on Marketing Objectives.
Included in this presentation;
A colourful and informative title slide outlining learning objectives. This slide includes animations
A Catchphrase starter activity where students guess the name of a business or product fro a range of picture clues
A recap fill the blanks starter activity that tests what student have learned about marketing so far (PowerPoint slide can be printed for students and answer key included)
Explanation of aims, objectives and mission statements
Match the mission statement activity
Detailed and contextualised notes on marketing strategy, SMART objectives
There are 35 slides in total and this lesson took me an hour to complete
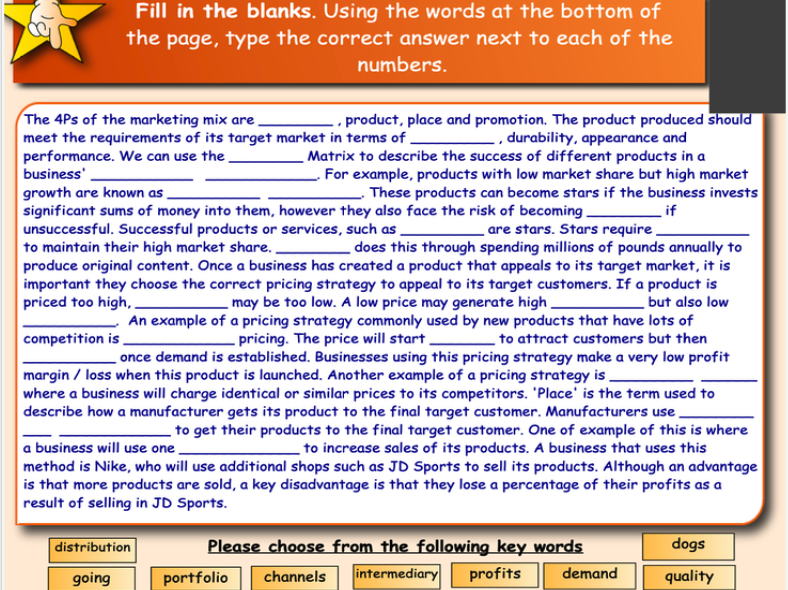
Marketing Mix RECAP STARTER
A fill the blanks activity on the 4Ps with emphasis on Boston Matrix
Answers are included
This is useful as a starter activity or plenary

Cash Flow Forecast Activity
Test your students’ knowledge of cash flow forecasts with this UNIQUE activity that demonstrates if students can calculate each of the different values.
This cash flow forecast contains a number of intentional errors that students need to identify and correct.
All instructions are included in the activity, but the key thing to note is that all yellow values cannot change, any others can.
Included in this activity are the following:
Page 1 - Instructions on how to complete the activity, a cash flow forecast (in colour) and an explanation of what the first error is and how it should have been calculated.
Page 2 - All errors have been circled. This can be shown after the cash flow forecast has been completed.
Pages 2 and 3 - Detailed explanations of all errors and how they should have been calculated.
Page 4 - The completed cash flow forecast with all answers.
How I run the activity:
Give students up to 10 minutes to complete the cash flow forecast
Once finished, ask students to explain any errors they have found (this took my class 10 minutes)
Show the circled errors on the board so that students can circle them
Explain each error in detail
Show the completed cash flow forecast on page 3 and get students to mark them. This will save you time.
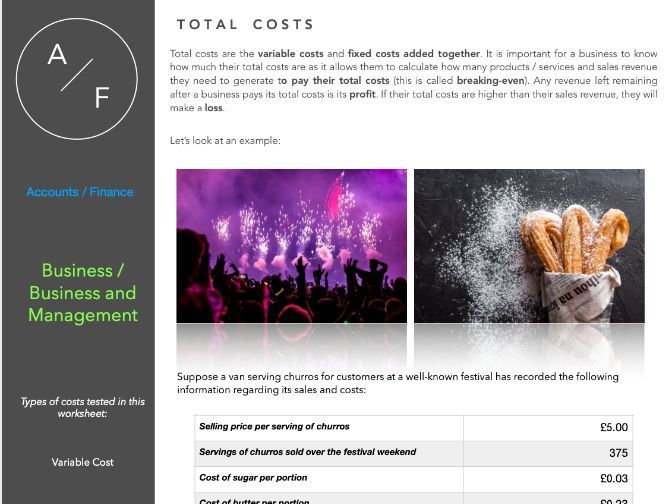
Types of Costs WORKSHEET (Fixed, Variable, Total, Average, Marginal, Direct, Indirect)
This worksheet contains revision notes and activities on how to calculate fixed costs, variable costs, total costs, average costs, marginal costs, direct costs and indirect costs)
All answers are included
The worksheet is colourful and creative throughout
This worksheet contains 7 pages of activities and took my students between 30 - 45 minutes to complete
Can be given as classwork / homework / revision
Inflation
Included in this PowerPoint:
A detailed and colourful title slide that outlines the key learning outcomes and equipment required for the lesson
A starter activity where students are required to guess how the price of 5 goods and services has changed over time (closest for each round wins). Students really enjoy this activity
Explanation of why / when inflation becomes a problem, how it affects incomes and sectors where incomes have risen lower and higher than inflation
Explanation in basket of goods / weighted index
Step by step explanation of how inflation is calculated using weighted index
Activity (with answers) where students are required to calculate inflation changes using a weighted index
Activity (with answers) - identify which goods and services have been recently added and removed from the basket of goods
Explanation of difference between demand-pull and cost-push inflation with examples
Diagrams for both types of inflation
Presentation is detailed and colourful throughout
There are 52 slides in total and this presentation took me an hour and a half to go through.
Marketing Mix - Place
Included in this presentation:
A fun Catchphrase starter activity (my students love this!)
A recap activity on cost-based pricing strategies with answers (feel free to remove or skip if you are you to cover this)
Notes and examples on the different methods of distribution
Notes on the pros and cons of each method of distribution
Notes on the importance of selecting the most appropriate method of distribution

Profitability Ratios (Gross Profit Margin, Operating Profit Margin, Return on Capital Employed)
A colourful and engaging resource designed for introducing profitability ratios (gross profit margin, operating profit margin and return on capital employed).
Included in this presentation:
A colourful title slide detailing the learning (lesson objectives) and equipment required for the lesson
Two detailed and colourful slides explaining what ratios analysis is and why it is conducted.
An introductory recap activity where students are required to calculate missing values for an income statement and balance sheet (answers provided)
Step by step and contextualised examples of how to calculate all three profitability ratios
Activities on all three ratios for students to complete (answers provided)
Explanations, analysis and evaluation of what could cause these ratios to improve and worsen.
This resource contains 29 slides and took me an hour and a half to fully go through.

Globalisation / Introduction to International Marketing
Using MCDONALD’S TSUKIMI BURGER, Tesco’s failure to succeed in the US, Apple’s failure to succeed in India, and many others, this PowerPoint seeks to explore the reasons why businesses wish to sell in international markets, the challenges and constraints.
Included in this PowerPoint:
A detailed title page, outlining the key skills covered in this topic
A recap on moving averages with answers. This topic is included in some syllabi earlier in the marketing unit but can be deleted if not required
A starter activity introducing the concept of globalisation where students need to match McDonalds products based on the country whey are sold
(demonstrating how products need to be adapted based on the market they are targeting). Answers are provided
An explanation of reasons why businesses choose to sell products in overseas markets
A contextualised example for each reason
Detailed explanations as to each of the reasons why how marketing activities need to change depending on which country goods are being sold
Video 1: Reasons why Tesco failed in US (poor marketing)
Video 2: Reasons why Apple failed in India (poor marketing)
Introduction to some of the factors that make trade between countries easier
This lesson took me an hour and a half to go through.

Capacity and Capacity Utilisation
A 52 slide presentation detailing capacity and capacity utilisation.
This presentation includes:
A depreciation starter activity
Introductory activity on the concept of capacity
Examples of capacity utilisation in different contexts
Calculation activity
Activity demonstrating hoe capacity utilisation impacts costs / average costs
Detailed notes throughout
This lesson took me an hour to go through.